Project · Open source · v2.40
sparkDash, every Spark in one window.
A real-time web dashboard for one or more NVIDIA DGX Sparks, and any Linux or Windows machine with an NVIDIA GPU, in a single browser window or as an app on your phone. It streams GPU, CPU, unified memory, storage, network and local LLM metrics, runs the benchmarks behind the speeds on my recipe pages, and lets you add, edit, reorder or remove machines without restarts.
What's new · v2.40 · October 11
LM Studio and Ollama, recognised for what they are.
LM Studio and Ollama, detected properly
sparkDash now finds LM Studio and Ollama through their own endpoints, so an LM Studio server is no longer labelled SGLang or vLLM, and a backend it has identified is never downgraded. Each LLM panel follows its port, not its place in the list, and the Add wizard and every LLM panel have LM Studio :1234, Ollama :11434 and TensorFold :8888 presets. From a contribution by @HassanEmam.
Windows PCs with an AMD iGPU
A Windows PC with an AMD iGPU (Strix Halo) now shows GPU use and memory from Windows' own GPU counters when there is no nvidia-smi.
Hide any Overview panel
Settings has a switch for Recent activity and for each tile: Fleet decode, Fleet power, Memory in use and Tokens today. The rest share the row, and hidden panels stay in the sidebar.
The Windows key gotcha, explained
For an administrator account, Windows reads keys from administrators_authorized_keys, not your own folder. The setup docs show the fix, and a refused key now says so.
v2.31 and v2.32 · October 10
RoCE / RDMA monitoring
Sparks with RDMA ports get a RoCE panel: link state and rate, traffic, errors and drops, PFC and QoS settings and the RDMA counters, read on the Spark itself with no root. Two new health alerts: a RoCE link went down, and RoCE is dropping packets.
A time zone setting
Pick a time zone in Settings and the Tokens, Energy and Activity charts follow it, so the 24-hour charts line up with your local time on any device you view them from.
LLMs reachable only over SSH
An engine on a port that only SSH reaches, like a remote Spark behind a NAT, is now monitored through an SSH forward, with a via SSH chip on its panel.
Honest speed readings
TensorFold prefill tok/s counts only the tokens it actually computed, so prefix-cache hits no longer read as 100k+, and the decode benchmark's live figure comes from its own streams instead of showing 0.
Calmer health alerts
A finding is held for 90 seconds, so a GPU sitting right at a threshold raises one event, not one a minute. /metrics also shows when each collector last returned real data.
- The iPhone app's header clears the status bar, and its icon is the logo
- The GPU history chart fills its panel on wide screens
- Dropping a Spark after dragging it no longer opens it
- Unified memory, CPU and Models share one row on the Spark page
Version 2.30 · October 10
Windows PCs, now in your fleet.
Windows PCs as units
Monitor a Windows PC with an NVIDIA GPU over its built-in OpenSSH Server, with no agent to install. Pick Windows PC with an NVIDIA GPU as the unit type, enter its LAN IP and your Windows user, and it joins the Overview next to your Sparks: GPU temperature, use, power, VRAM and processes, plus RAM, uptime, CPU load, disks, network and shutdown.
Why 2.30? It is 2.0.0 plus 0.01 for each of the 30 issues and pull requests closed since 2.0 shipped, one day earlier.
A phone app
sparkDash installs to your home screen as an app (PWA) and runs fullscreen with its own icon, over HTTPS such as Tailscale Serve. Live data always comes from the network.
Prometheus export
An opt-in /metrics endpoint, so Prometheus, VictoriaMetrics or Grafana can keep your fleet history beyond the dashboard's own.
Monthly energy history
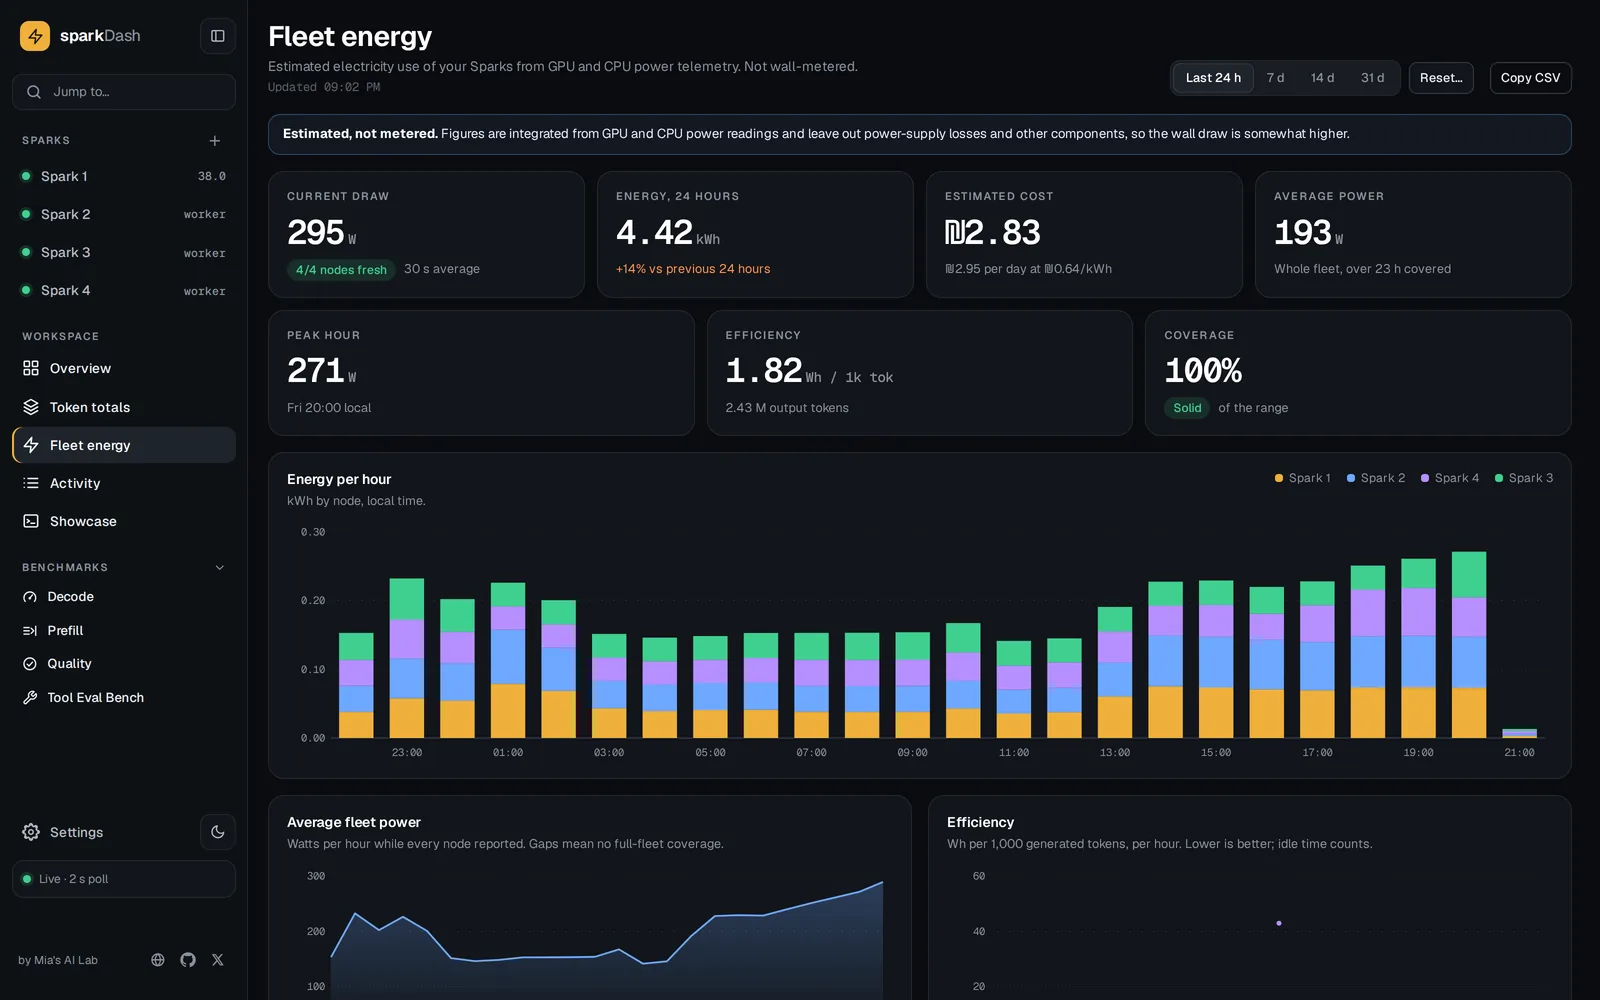
Fleet energy keeps a permanent total per month, with cost, Wh per token and a year view of twelve monthly bars. It survives resets and restarts.
Every GPU on its own line
On hosts with several GPUs the history graph switches between Combined, All GPUs and a single card. Single-GPU hosts look as before.
Smarter benchmarks and controls
A model picker for multi-model servers in the decode benchmark, a per-Spark llmHost, a working poll-interval setting, and a Restart button after a fleet change.
- Docker upgrades no longer end on "Frontend not built"
- The SSH tunnel fallback for benchmarks and the Showcase works again
- Model launchers no longer inherit sparkDash's own port
- A token-protected remote setup no longer shows a blank page
Version 2.0 · October 9
A new sparkDash, rebuilt from the shell up.
A new shell
A sidebar, a command palette (Ctrl/⌘ K), four themes (White, Light, Dark, OLED), smooth page transitions and real links everywhere: right-click, new tab.
A rebuilt Overview
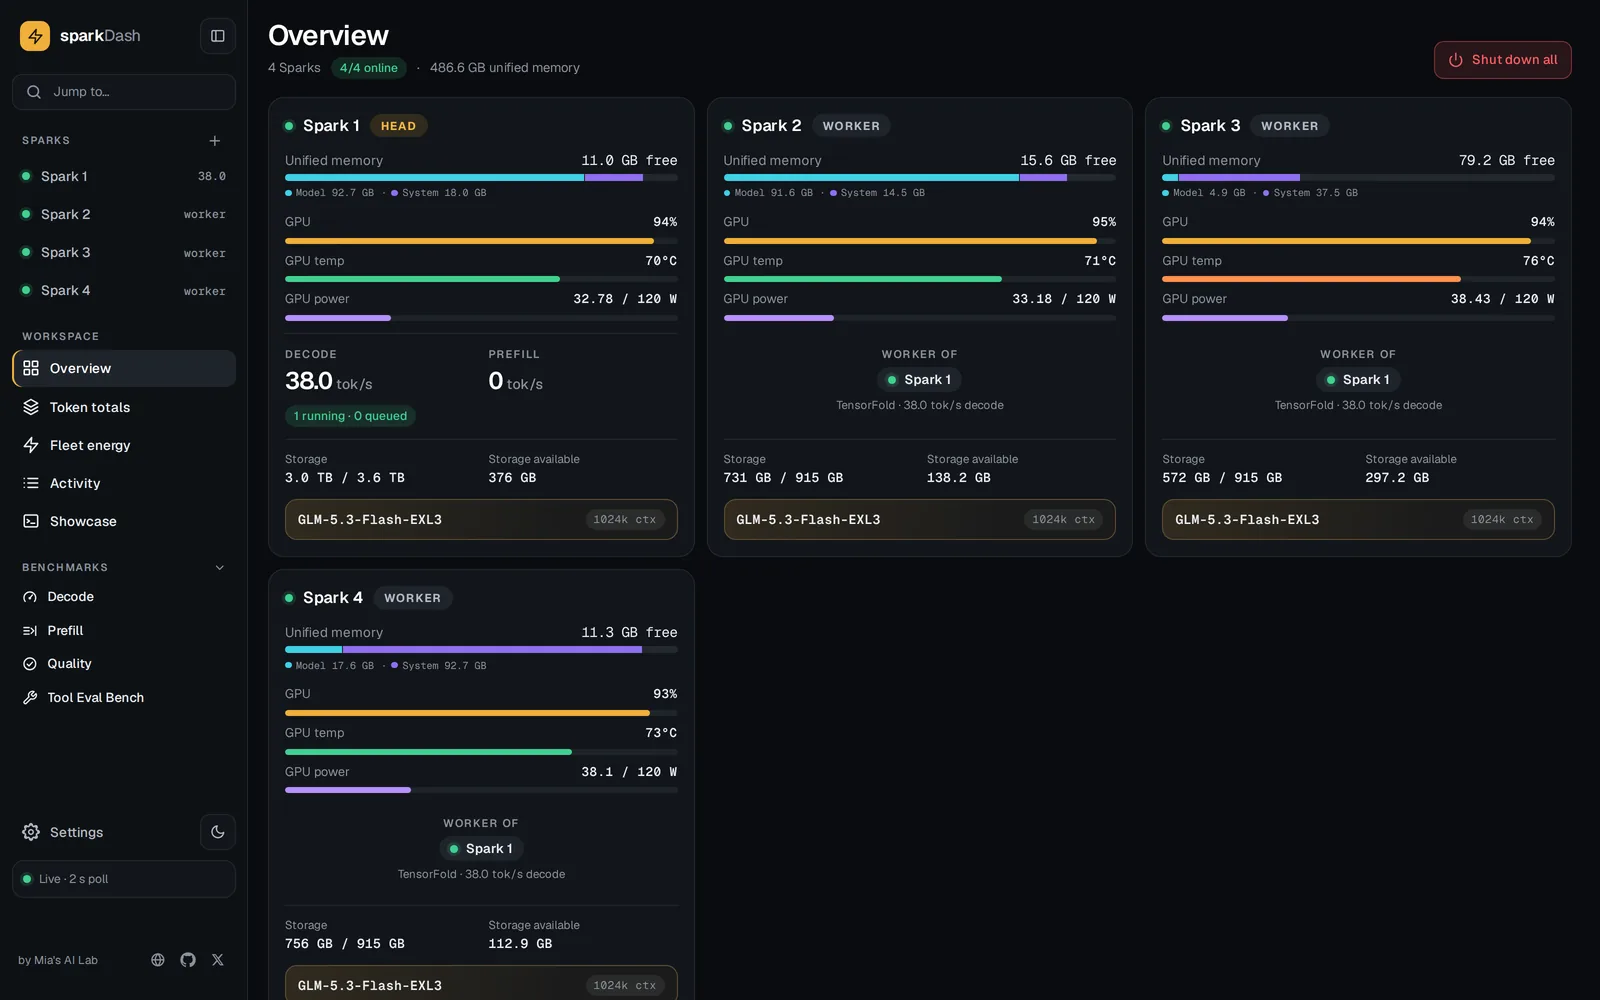
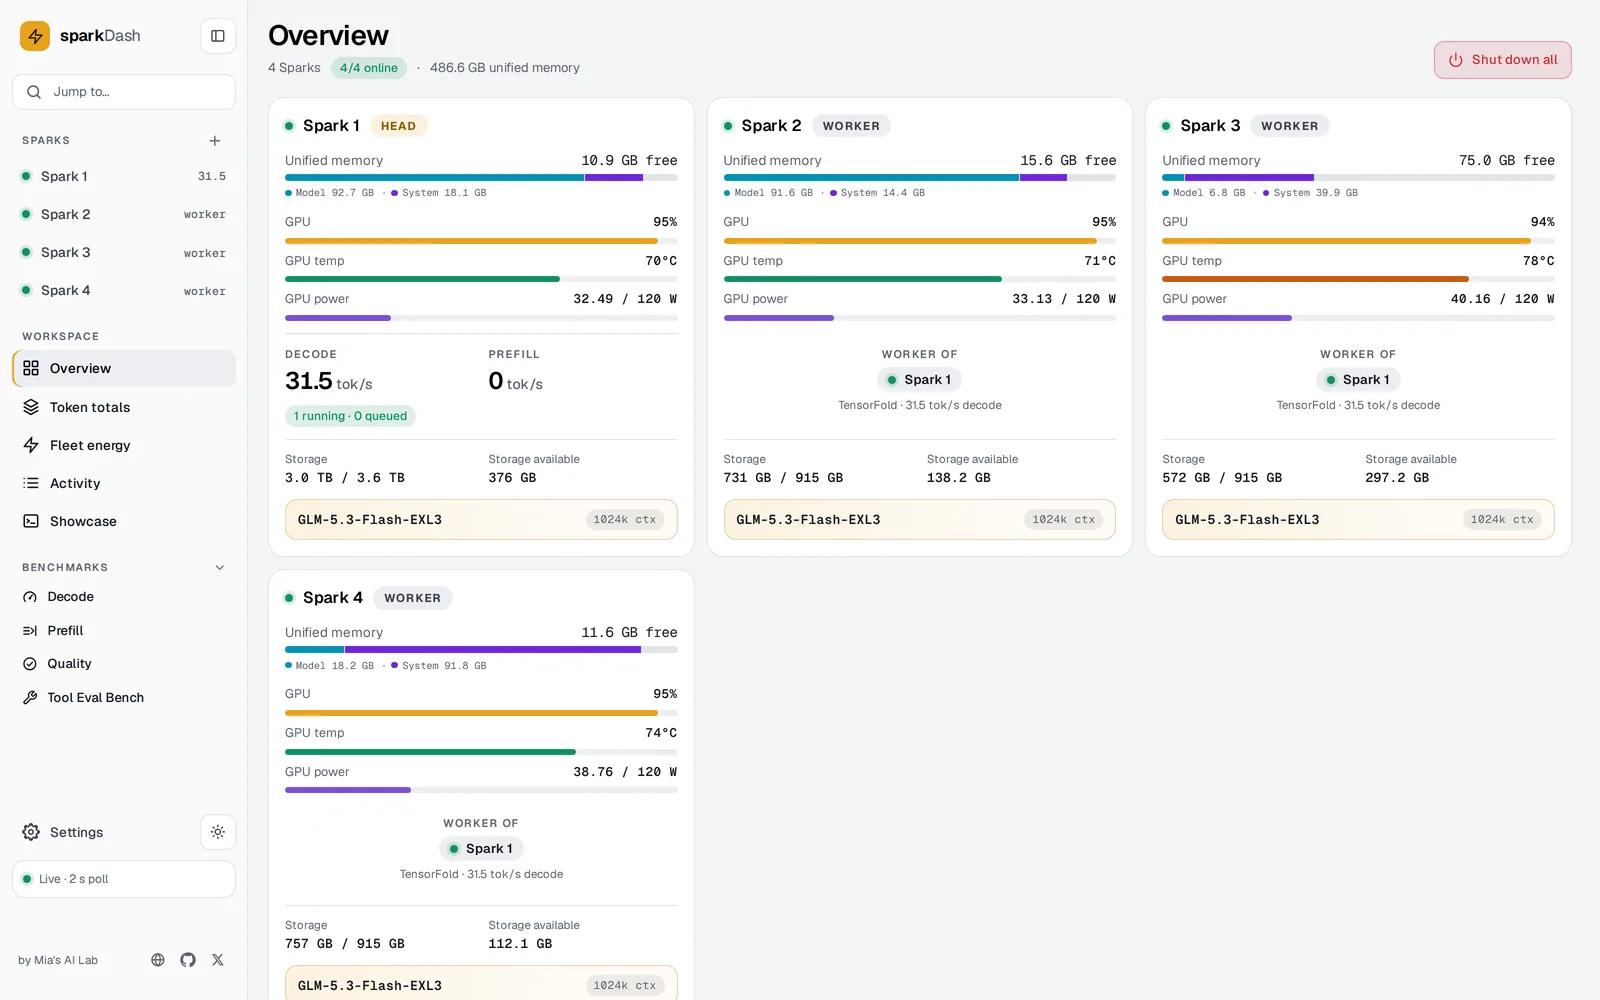
A card per Spark with the model row, head and worker relations, a Model/System memory bar, and a launcher to load a model from the card.
A Benchmarks section
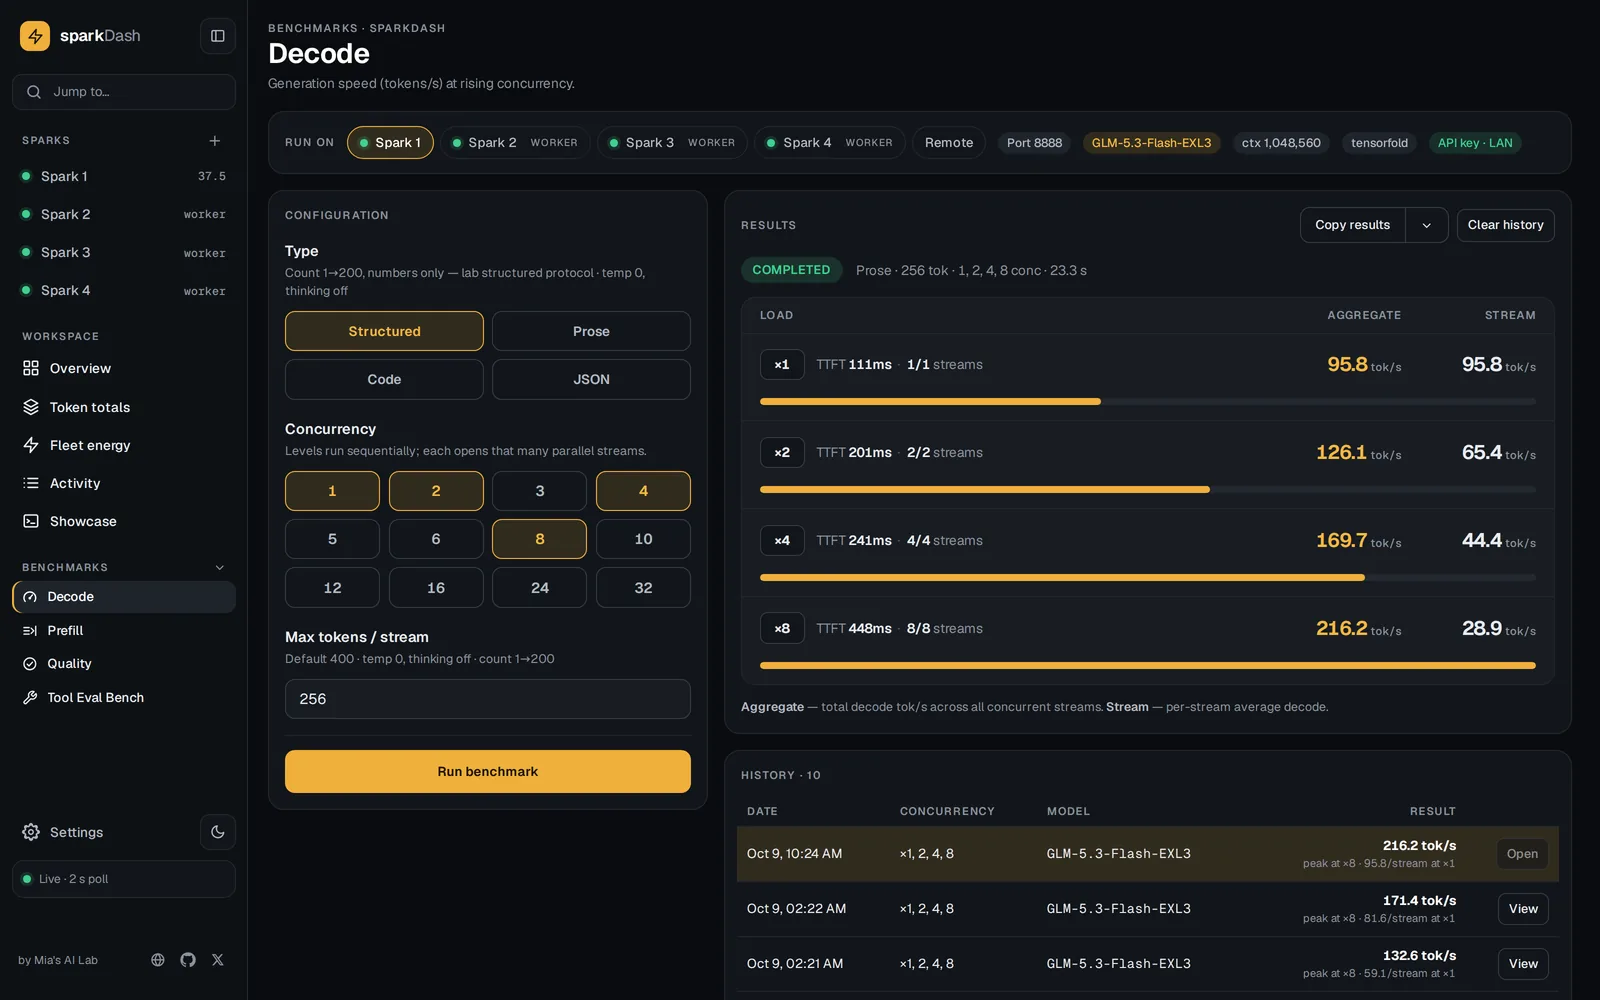
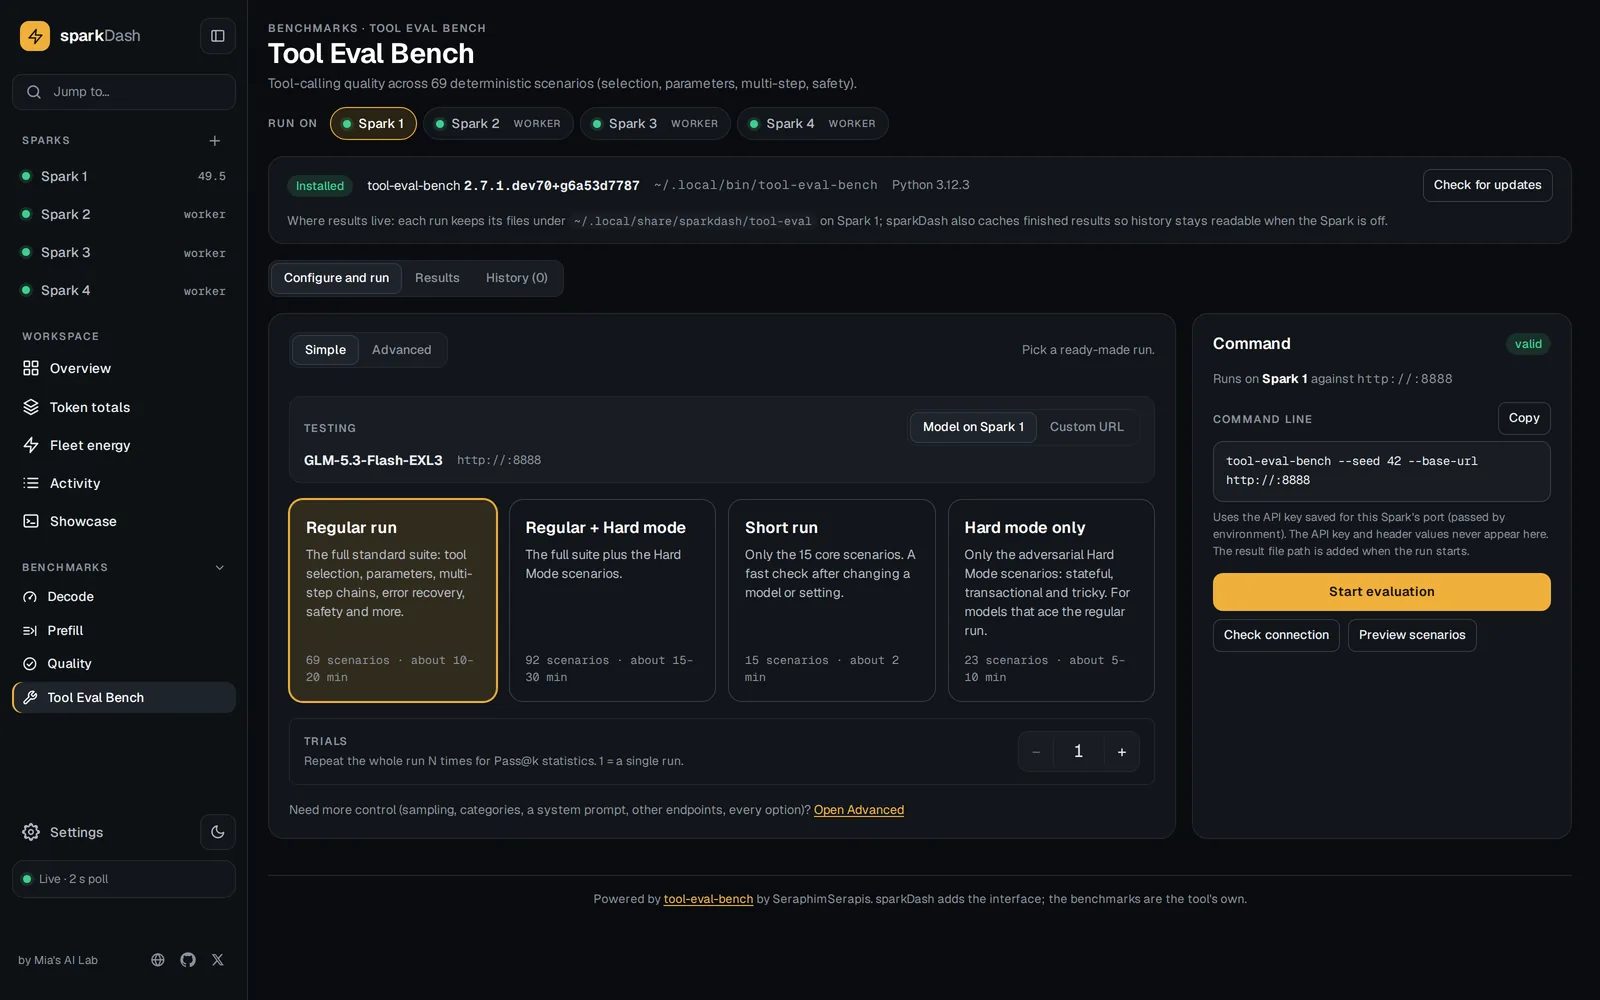
Decode, Prefill, Quality and the new Tool Eval Bench, with trials, side-by-side compare and a one-click upgrade.
Pages of their own
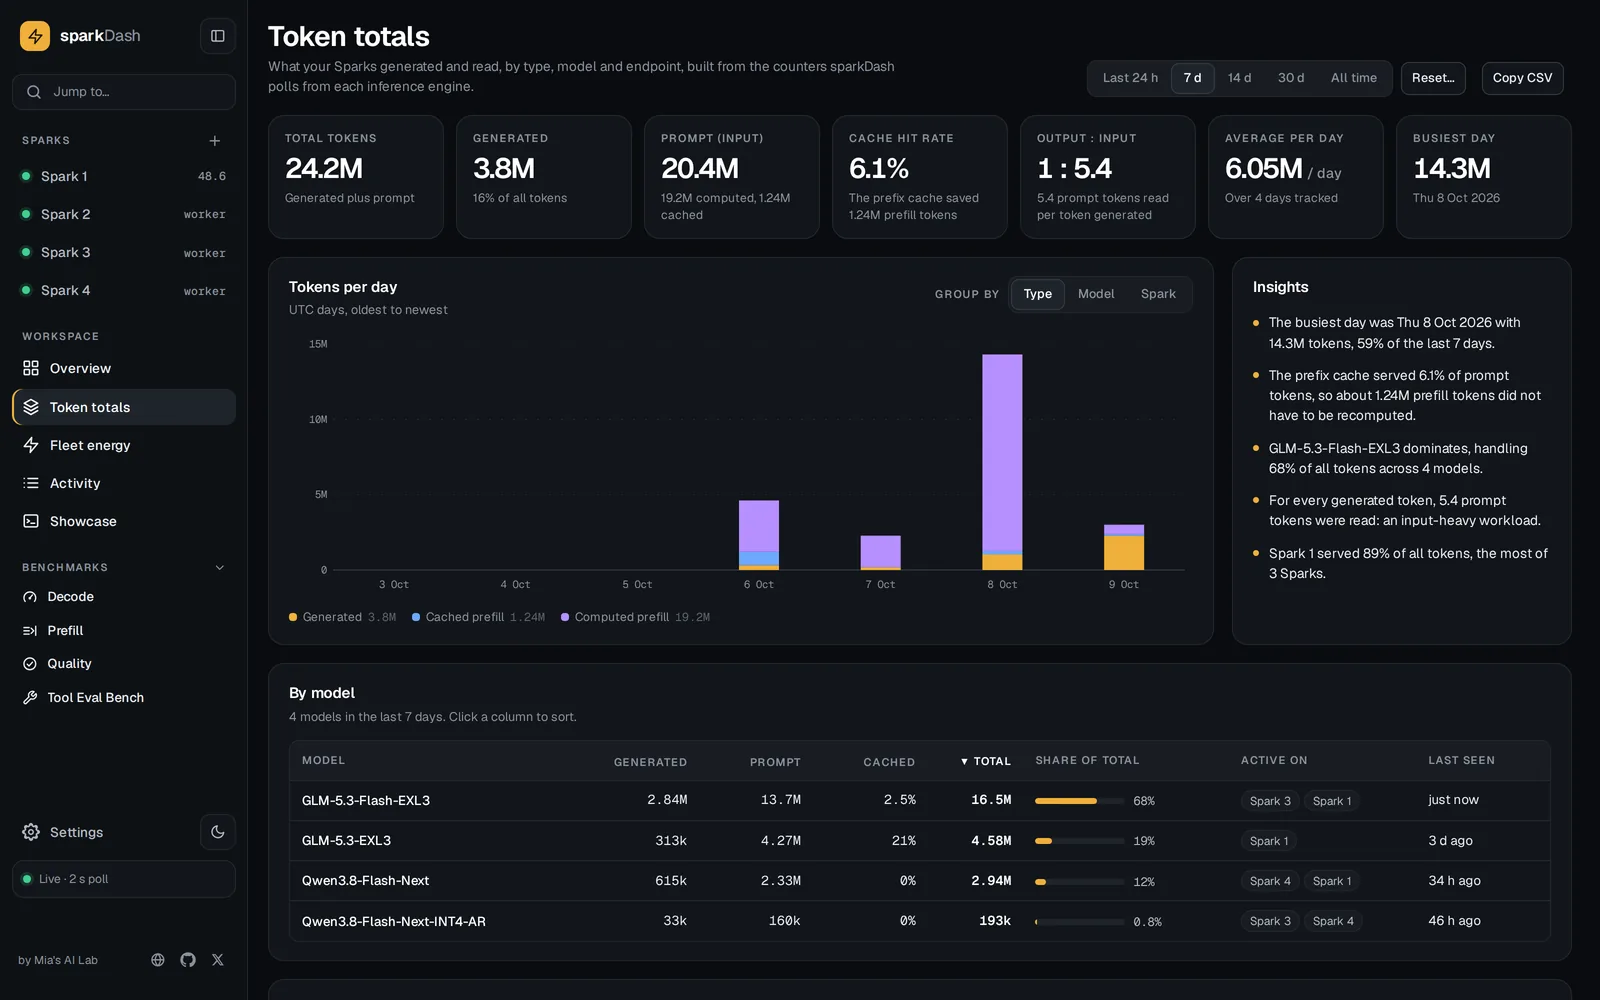
The Prompt Showcase is now an in-app page with much smoother streaming, and Token totals, Fleet energy and Activity each get a page.
Run your models from it
Start and stop your own LLMs from the dashboard, watch live prefill tok/s during long prefills, and score models with GSM8K and MMLU in the Quality bench.
Everything since 1.0 is in the CHANGELOG.
A look inside
Monitor, benchmark, compare.
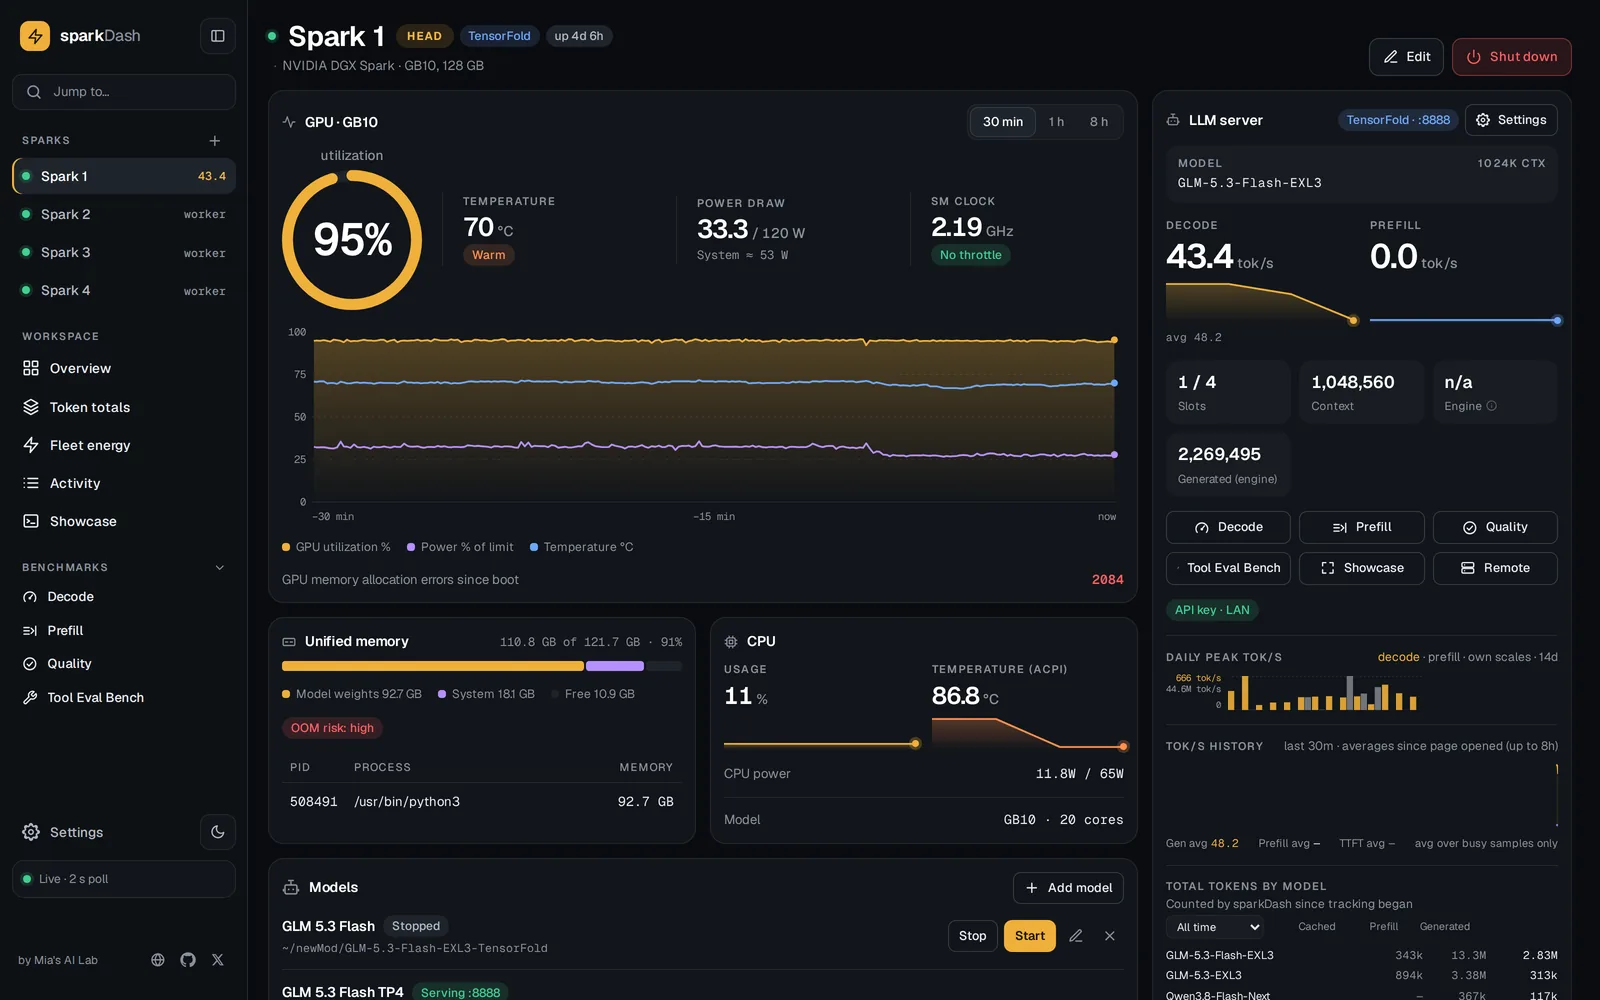
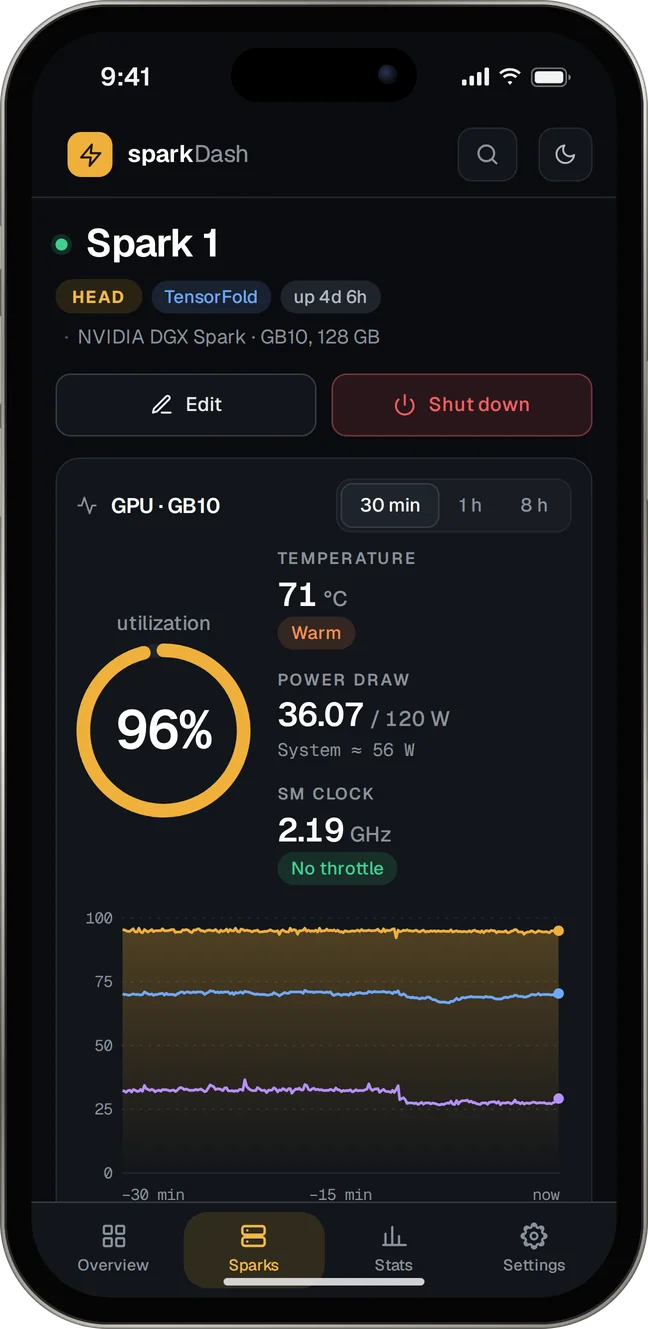
Screenshots from my own lab: four DGX Sparks serving GLM 5.3 Flash on TensorFold. Network addresses are hidden.
On your phone
Your lab, in your pocket.
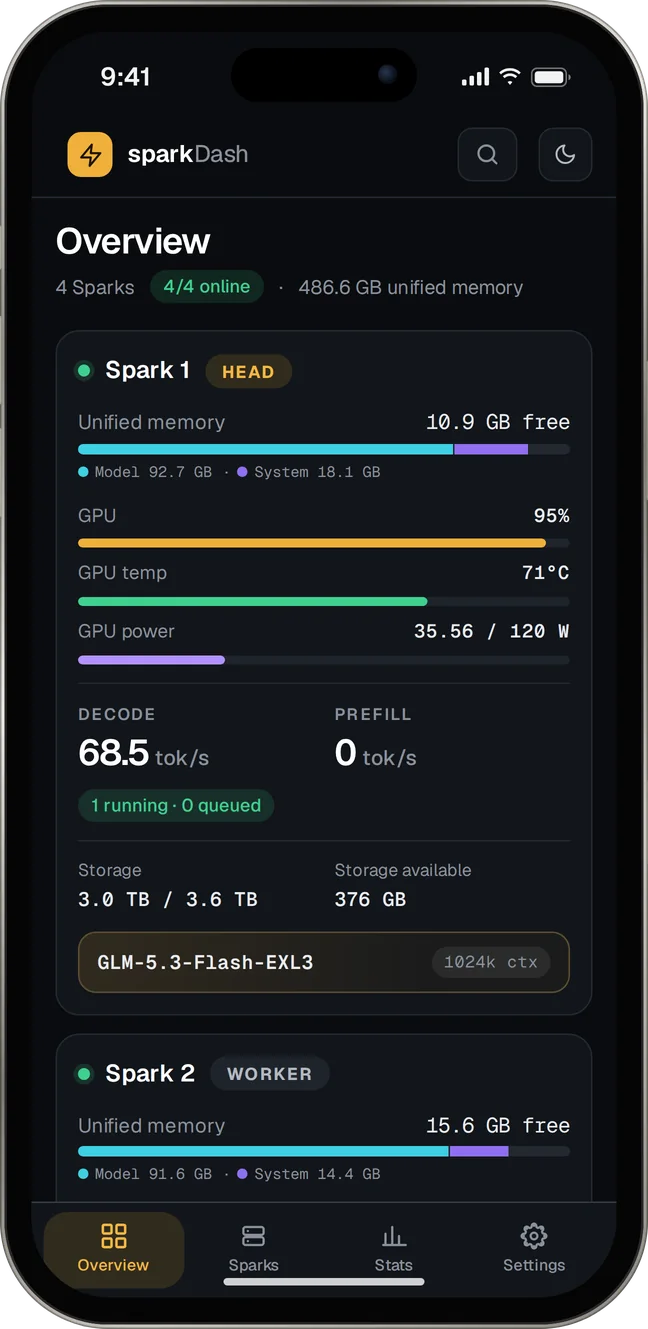
The same dashboard on a phone, with its own tab bar: the Overview, each Spark, the stats and the settings. Since 2.30 it installs to your home screen as an app and opens fullscreen. Installing needs HTTPS, for example Tailscale Serve; on an iPhone, use Share, then Add to Home Screen.
What you get
Built for the GB10, open to any NVIDIA GPU.
Multi-unit
Any number of units, each with a tabbed detail page, plus a shared Overview. Add, edit, reorder or remove them from the UI, with no restart.
Not only Sparks
Any Linux or Windows machine with an NVIDIA GPU (and Windows PCs with an AMD Strix Halo iGPU) is a first-class unit, with separate RAM and VRAM panels, and a block per card on multi-GPU hosts.
Live LLM probe
Auto-detects llama.cpp, vLLM, SGLang, LM Studio, Ollama, ds4-server, EXL3, TensorFold, FreeToken and q27, with live decode and prefill tok/s and a daily peak.
Inference health
KV cache, run and wait queue, TTFT, E2E and ITL p95, preemptions, prefix cache and MTP acceptance, from the server's own metrics.
Unified memory and RoCE
The GB10's 128 GB pool, with the GPU/CPU split and bandwidth from nvidia-smi dmon, and the RoCE links between your Sparks.
Integrations
An opt-in Prometheus /metrics, ComfyUI jobs and queue, Hermes Agent updates over SSH, a Tailnet check that flags a unit that left its tailnet, and a Glance widget.
Power controls
A graceful shutdown per Spark or for all of them, and Wake-on-LAN for GPU hosts whose network card supports it.
Secrets stay secret
SSH passwords are encrypted with AES-256-GCM and never appear in the config file or in API responses.
Quick start
Running in two commands.
Clone and start it with Docker
git clone https://github.com/MiaAI-Lab/sparkDash.git
cd sparkDash
docker compose up --build -d
Then open http://127.0.0.1:5555 on that machine. Add the machine it runs on as This host, and every other Spark or GPU box with its LAN IP and an SSH key.
Open it from another computer
ssh -N -L 5555:127.0.0.1:5555 user@sparkdash-hostsparkDash listens on loopback by default. For shared access use an authenticated TLS reverse proxy or Tailscale Serve, or set BIND_HOST=0.0.0.0 together with SPARKDASH_TOKEN: without a token, anyone who can reach the port can change settings and power your machines off.
The README has the rest: SSH keys in Docker, Windows PCs, the phone app over Tailscale Serve, Prometheus, every setting, the REST API and the security notes.
Credits
Built with the community.
Thank you to everyone who sent code, fixes and ideas: @MikeGibbsOnyx, @Lesilva, @vincenzopalazzo, @Acermax, @danielkuykendall23-boop, @0xdfi, @BHCC2025, @ayylemao, @SashaMIT, @krunkosaurus, @andrei-dotdna, @0xWhiteMage, @kesslerio, @nkavassalis, @Olyno, @willy92wins, @saitakarcesme, plus Nyx Voss (who wrote the macOS collectors with C. Michael Gibbs), Liao Shiwu and Philip Eriksson, and everyone who reported issues. In 2.30, thanks to @HassanEmam for the phone app and @oscarlius for the FreeToken tests. In 2.40, thanks to @HassanEmam again for LM Studio and Ollama detection and AMD iGPU support on Windows. The Glance widget was contributed by @linxichen.
Built on
Free, and open.
- License: Apache 2.0 from version 2.0.0. Versions up to 1.9.0 stay MIT.
- tool-eval-bench by SeraphimSerapis (MIT) powers the Tool Eval Bench.
- GSM8K (OpenAI) and MMLU (Dan Hendrycks) supply the Quality bench's maths and knowledge questions.
- The health findings were inspired by spark-doctor by joeynyc; no code from it is used.
- React, Vite, Tailwind CSS, Express and ws; fonts Geist and Geist Mono by Vercel.
See your whole lab at a glance.
Free and open source, for one Spark or a whole fleet.